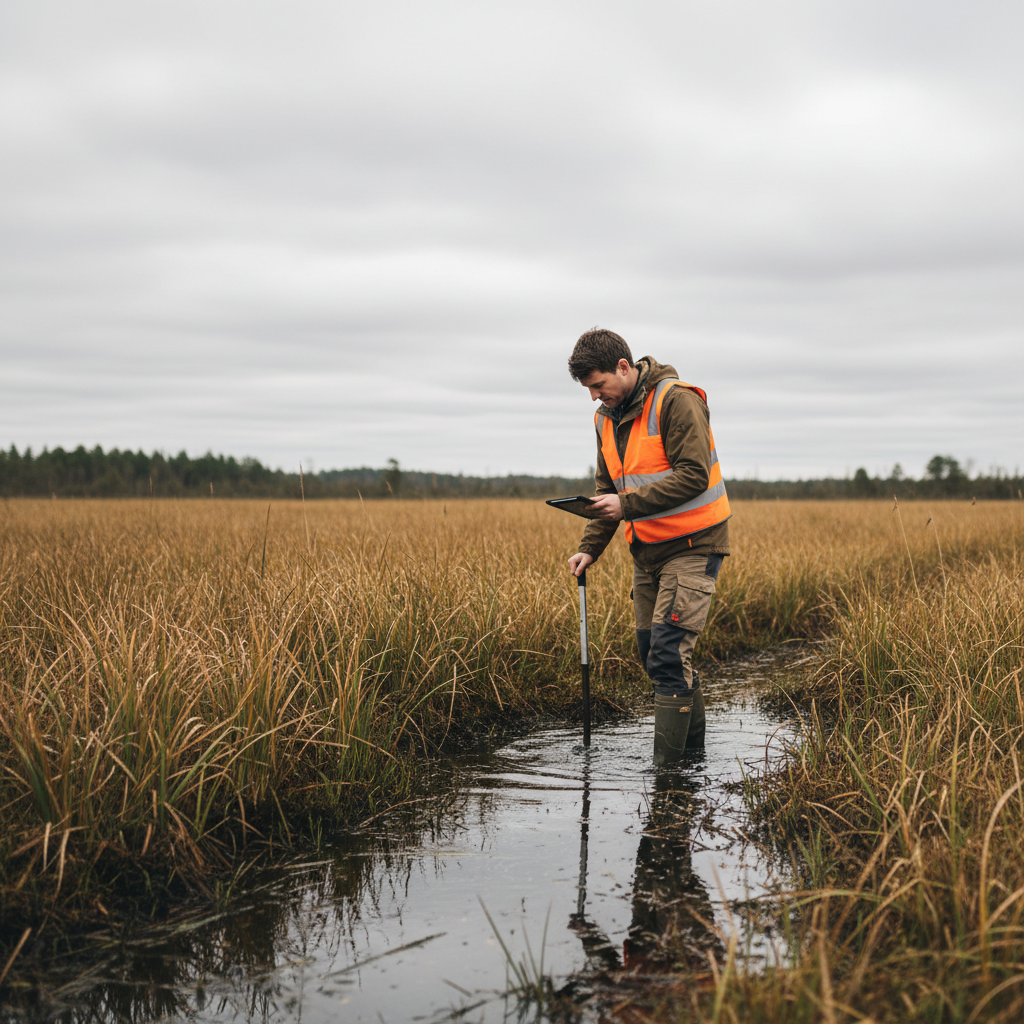
Wetland delineation is one of the most data-intensive tasks in environmental consulting. Each data point requires documenting vegetation, soils, and hydrology across standardized forms — typically the Army Corps of Engineers' Routine Wetland Determination Data Form.
It's also one of the tasks where paper forms cause the most problems.
The Wetland Delineation Data Challenge
A routine wetland delineation involves:
- Data point forms with 30+ fields covering three parameters (vegetation, soil, hydrology)
- Vegetation plots listing dominant species by stratum with percent cover
- Soil boring logs documenting horizons, matrix color (Munsell), and redoximorphic features
- Hydrology indicators from a checklist of primary and secondary indicators
- GPS coordinates for every data point
- Photo documentation of vegetation, soils, landscape position, and hydrology indicators
On a typical project, a two-person crew might complete 15-25 data points per day. That's 15-25 multi-page forms, dozens of soil descriptions, hundreds of plant identifications, and 50-100 GPS-tagged photos.
On paper, this is a marathon of writing, erasing, and hoping your notes survive the conditions.
Where Paper Fails in Wetland Delineation
Munsell Color Notation
Anyone who's recorded Munsell soil colors on a soggy paper form knows the struggle. Writing "10YR 4/2" legibly with muddy gloves in the rain — then reading it three weeks later in the office — is an exercise in frustration.
Digital forms with Munsell color pickers eliminate ambiguity. Select the hue, value, and chroma from a structured menu. No more debates about whether that's a 4/2 or a 4/3.
Dominant Species Calculations
The 50/20 rule for determining dominant species requires math in the field — ranking species by percent cover and calculating running totals. On paper, this means scratching out numbers and recalculating when you realize you missed a species.
A digital form can calculate dominance automatically as you enter species and cover values. The form highlights which species qualify as dominant in real time.
Hydrology Indicator Checklists
The Corps' data form includes long checklists of primary and secondary hydrology indicators. On paper, it's easy to skip sections or check the wrong box. Digital forms can use conditional logic: if you check "Surface Water," it can prompt for depth and extent. If no primary indicators are present, it can automatically flag that the hydrology criterion is not met.
Photo-Data Point Linking
The most common post-fieldwork headache: matching photos to data points. On paper, you write "DP-1" on the form and "DP-1" in the photo log and hope the photo numbers line up. They often don't.
Digital collection ties photos directly to data point records with automatic GPS tagging. The photo is part of the data point — no separate log, no matching, no errors.
What Digital Wetland Delineation Looks Like
Here's a typical digital workflow for a wetland delineation data point:
- Navigate to the data point using GPS on your device
- Open a new data point form — GPS coordinates auto-populate
- Record vegetation by stratum — select species from a searchable list, enter cover percentages; dominance calculates automatically
- Document soils — select Munsell colors from a picker, describe horizons, note redoximorphic features with checkboxes
- Check hydrology indicators — tap applicable primary and secondary indicators from the organized checklist
- Take photos — they're automatically GPS-tagged and linked to this data point
- Mark wetland determination — the form summarizes whether all three criteria are met
- Move to the next point
Back at the office, all data is already digital. Export to your preferred format — PDF data forms, CSV for analysis, shapefiles for GIS mapping — without transcription.
Time Savings in Real Numbers
Based on conversations with environmental consultants who've made the switch:
| Task | Paper (per data point) | Digital (per data point) |
|---|---|---|
| Form completion in field | 20-30 min | 15-20 min |
| Transcription in office | 15-25 min | 0 min |
| Photo management | 10-15 min | 0 min |
| QC review | 5-10 min | 2-3 min |
| Total per data point | 50-80 min | 17-23 min |
For a project with 100 data points, that's a difference of roughly 55-95 hours — nearly two weeks of billable time.
Choosing a Platform for Wetland Delineation
Not every field data app handles wetland delineation well. Key requirements:
- Offline operation — wetlands rarely have cell service
- Complex form logic — conditional fields, auto-calculations, nested data (species within strata within vegetation plots)
- Munsell color support — structured selection, not free text
- Unlimited photos with GPS — multiple photos per data point feature
- GIS export — shapefiles, KML, or GeoJSON for mapping data points
- Corps data form format — export that mirrors the standard form layout
FieldTap includes purpose-built wetland delineation forms with Munsell pickers, automatic dominance calculations, and Corps-format exports. Try it free on your next delineation project.